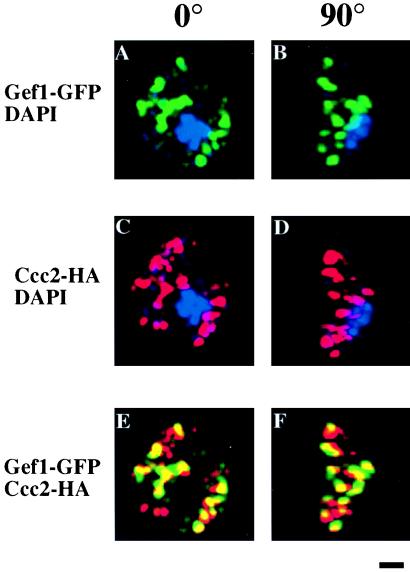
Figure 3.
Distribution of fluorescence in gef1 ccc2 cells transformed with two constructs: a GEF1-GFP fusion and a CCC2-(HA)3 tagged fusion. The strain RGY250 (gef1 ccc2) was transformed with plasmids pRG151;GEF1-GFP and pDY219;CCC2-(HA)3. Transformants were grown in iron-depleted medium, fixed, and stained with antibodies to HA epitope and 4′,6-diamidino-2-phenylindole. Cells were viewed by charge-coupled device microscopy and sectioned by using scanalytics (Billerica, MA) (21). (Bar = 1 mm.) (A) Image obtained from Gef1-GFP fluorescence. (B) The same image rotated 90°. (C) Image obtained from inmunodetection of Ccc2-(HA)3. (D) The same image rotated 90°. (E) Image obtained from the superimposition of A and C. (F) Image obtained from the superimposition of B and D. 4′,6-Diamidino-2-phenylindole was omitted from images E and F.

