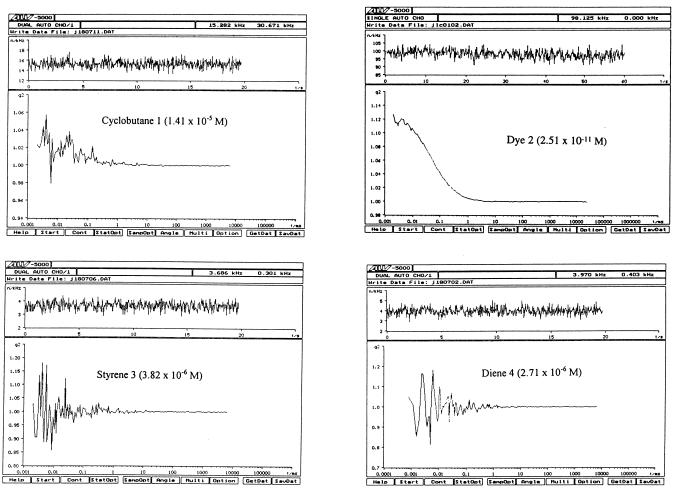
Figure 2.
Autocorrelation functions for samples of 1–4 in heptane. Samples were irradiated at 457 nm (0.5 mW) and collected through an Omega Optics 530 bandpass 45 filter. For each sample, the upper trace indicates the frequency of emitted photons of light (kHz). The lower trace provides the autocorrelation function, where the number of particles inside the volume element is given by 1/g2.

