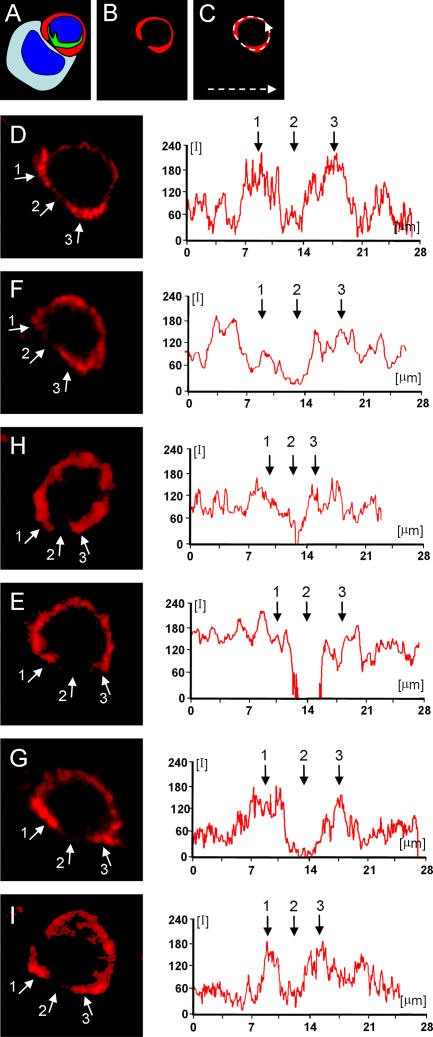
Figure 10.
Quantitative distribution of LFA-1 through the plasma membrane of T cells involved in formation of mature immunological synapses. The relative fluorescence of LFA-1 was measured in six T cells forming mature immunological synapses contacting virally infected cells (A). The red LFA-1 channel was selected [B] and the complete distribution of LFA-1 throughout the extent of the plasma membrane was delineated measuring the intensity of fluorescence in a linear graph (illustrated schematically in C). Panels D–I show the quantification of LFA-1 in six different cells forming mature immunological synapses. Small white arrows ‘1’ and ‘3’ indicate the p-SMAC and arrow ‘2’ the c-SMAC. Note that the level of LFA-1 is reduced (or absent) within the c-SMAC of all cells. Further LFA-1 levels are increased in the p-SMAC in some cells (illustrated in D, G, and I), while it does not increase in the p-SMAC of others [F, H, E]. Note that for clarity the target virally infected cells, found in apposition of the immunological synapses illustrated, are not shown; synapses shown in (D) and (E) are illustrated in further detail in Fig. 7, and synapse (F) in Fig. 8 A. Synapses H, G, and I are not illustrated further.

