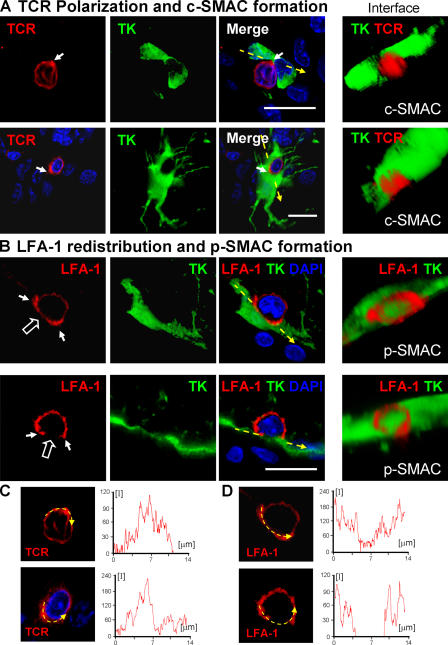
Figure 7.
Formation of c-SMAC and p-SMAC in vivo. TCR polarization and clustering within c-SMAC (A) and LFA-1 distribution to the p-SMAC (B). TCR staining is polarized to membrane areas displaying close contacts between T cells and infected brain cells, and clusters at sites where immunological synapses form (two different immunological synapses are shown in A and C). Three-dimensional reconstructions allow visualization of the formation of c-SMAC at the interface of lymphocytes and infected cells (A, under “Interface”); the quantification of the clustering of the TCR at the c-SMAC of the immunological synapses shownin A is illustrated in C (yellow arrow and intensity graph). LFA-1 forms a ring (p-SMAC) that surrounds c-SMAC, but is reduced within c-SMAC itself (two different immunological synapses are shown in B and D). Three-dimensional reconstructions show the LFA-1 immunoreactive p-SMAC ring at the interface between the T cells and target infected brain cells (B, under “Interface”); the quantification of the distribution of LFA-1 immunoreactivity at the p-SMAC of immunological synapses shown in B is illustrated in D (yellow arrow and intensity graph). Bars, 25 μm.

