
Figure 1.
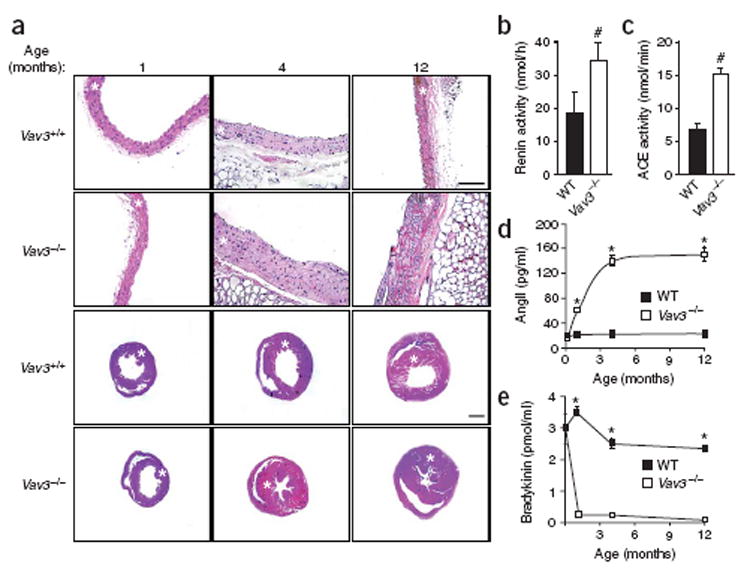
The cardiovascular system in Vav3−/−mice. (a) Histological sections of aortas (first and second row) and hearts (third and fourth row) from mice of the indicated genotypes and ages. Asterisks indicate aortic media layers and left ventricles. Scale bars, 100 μm. Sections are representative of 6–14 mice of each genotype. (b,c) Levels of renin (n =9;b) and ACE (n = 5; c) activity in wild-type (WT) and Vav3−/− mice. (d,e) Plasma levels of AngII (n ≥ 5; d) and bradykinin (n ≥ 5; e) in wild-type (WT) and Vav3−/− mice of the indicated ages. Error bars represent s.e.m. #P < 0.05, *P < 0.01.