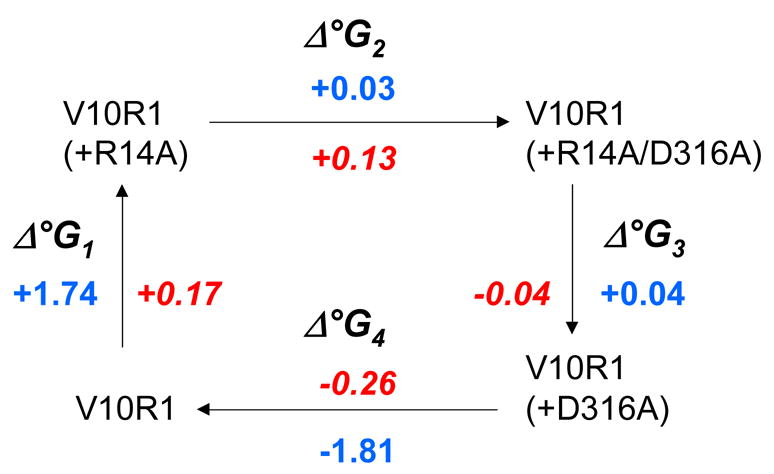
Figure 3.

Δ°G changes and mutant cycle analysis for the BtuB Ton box. The values of Δ°G are actually ΔΔ°G changes in the Ton box unfolding equilibrium between the two indicated BtuB mutants. Blue numbers represent free energy changes in kcal/mole for the substrate free BtuB, red numbers indicate the free energy changes found in the presence of substrate. The free energies were estimated from EPR spectra of V10R1. These spectra result from an R1 label that has two motional modes where the narrower spectral component corresponds to the unfolded (undocked) form of the Ton box.14 Spectral subtraction was used to deconvolute the spectrum and determine the populations of docked and undocked Ton box. This resulted in an error in the estimate of the free energy differences of approximately 50 to 100 cal/mole.
