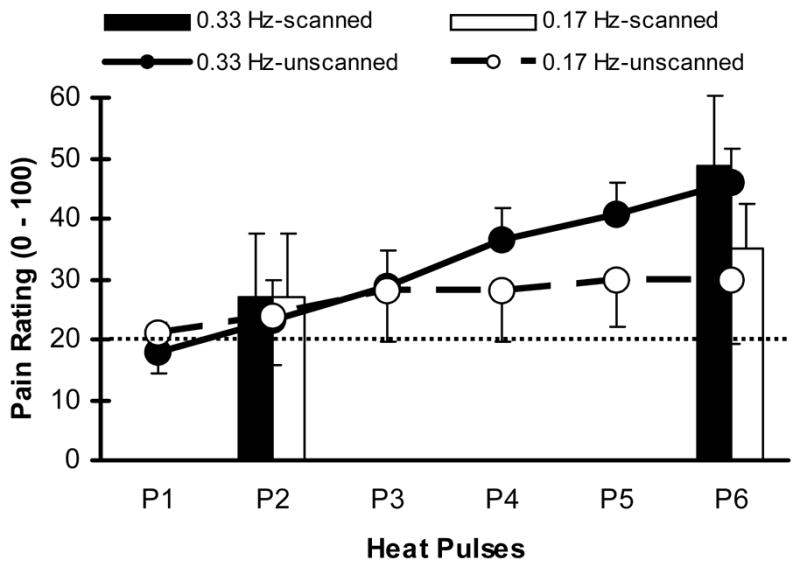
Figure 2.

Mean (SD) pain ratings of study subjects during two and six pulse trains at stimulus frequencies of 0.33 Hz and 0.17 Hz. All subjects were asked to remember the number ratings of the pain intensity related to the last heat pulse in a series until the end of each scanning run. Solid bars (0.33 Hz) and hatched bars (0.17 Hz) show these memorized pain ratings of 2-pulse and 6-pulse scanning runs, respectively. Solid (0.33 Hz heat pulses) and dotted lines (0.17 Hz heat pulses) depict mean pain ratings of each of six heat pulses during separate unscanned trials. Pain ratings of the 2nd or 6th heat pulse obtained during scanned and unscanned trials were not significantly different at either stimulus frequency (all p > .05). A rating of 20 represents pain threshold (dotted line).
