
Fig. 2.
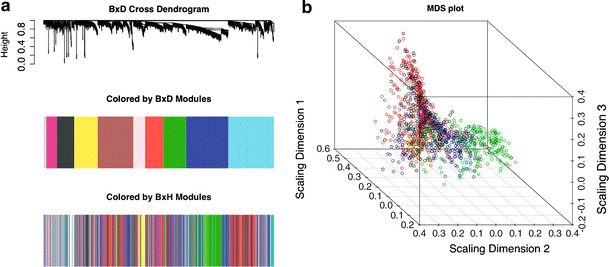
a (Top) Average linkage hierarchical clustering dendrogram of the B × D cross. (Middle) Visualization of the modules in the B × D network; module colors correspond to branches of the dendrogram shown above. (Bottom) Visualization of rough module preservation. Here we color the genes by the colors of the original B × H (not B × D) cross. The fact that colors stay together suggests module preservation. b Multidimensional scaling (MDS) plot of B × D mouse cross data, with coloring by B × H module definitions