
Fig. 2.
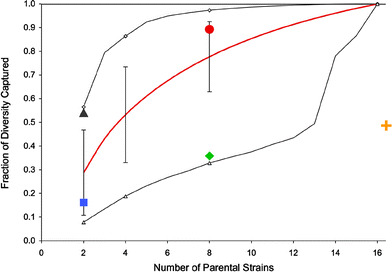
Genetic diversity captured as a function of the number of parental strains. Depicted are the ranges of genetic diversity that can be captured in resources with varying numbers of contributing parental strains based on the NIEHS resequencing data. The red line represents the average diversity captured and vertical bars represent the standard deviation. Open diamonds and open triangles represent the maximum and minimum diversity captured by 2, 4, 8, and 16 parental strains, respectively. In addition, the diversity captured in the BXD RI (blue square), the B.P CSS (gray triangle), the Northport HS (green diamond), the Collaborative Cross (red circle), and the LSDP (orange cross) is shown