
Fig. 3.
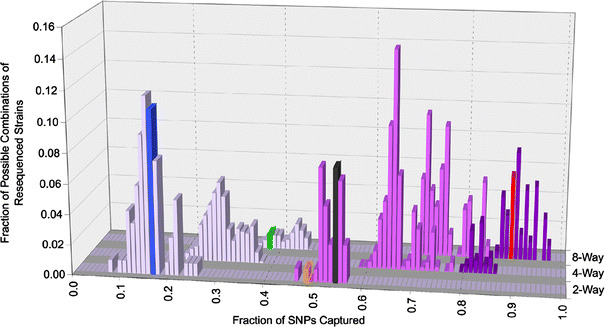
Genetic diversity captured as a function of the number and origin of parental strains. The individual diversity captured by every possible combination of two, four, and eight parental strains that can be generated among the sequenced strains is shown. The increasing number of subspecies (1–3) represented among the parental strains is denoted by an increasingly darker shade of purple. The diversity captured in the model resources is shown in their respective color as described in Fig. 2 (BXD RI, blue; B.P CSS, gray; Northport HS, green; LSDP, orange; CC, red). The LSDP is shown in the two-way cross for simplicity since there are more than eight strains involved