
Fig. 5.
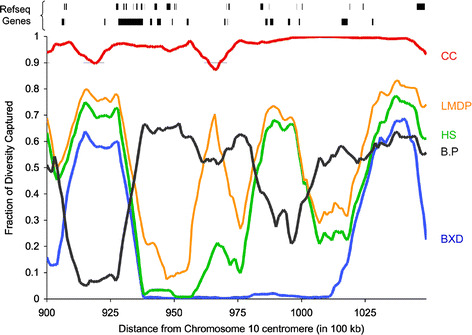
Genetic diversity captured in consecutive intervals in a 15-Mb region on mouse chromosome 10. The distribution of diversity captured by each resource is shown. Plots are generated from 1-Mb windows with 0.9-Mb overlap on mouse chromosome 10 from position 90 Mb to position 105 Mb. The location of Refseq genes is also shown (top). The color scheme and the abbreviations are as described in Fig. 2 (BXD RI, blue; B.P CSS, gray; Northport HS, green; LSDP, orange; CC, red)