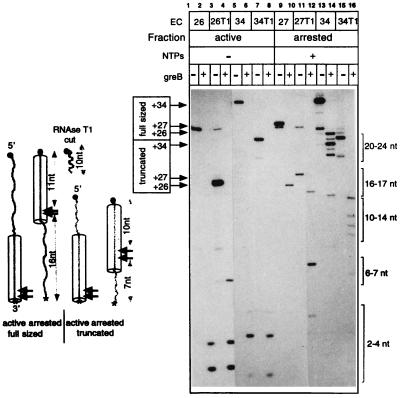
Figure 4.
GreB-induced cleavage of the RNA in active and arrested complexes. (Right) Active EC26 and EC34 and homogeneous arrested EC27 and EC34 containing full-sized (lanes 1, 5, 9, and 13) or 5′-truncated transcripts (lanes 3, 7, 11, and 15) were labeled in the position +26A of the RNA (EC26, EC27, EC26T1, and EC27T1) or in position +34C (EC34 and 34T1; EC34T1 was obtained by walking with unlabeled EC26T1). The products of GreB cleavage were fractionated by centrifugation and the supernatants displayed the 3′-terminal fragments dissociated from the complexes. The arrows on the left side of the autoradiogram indicate the nontreated transcripts, and the brackets on the right side indicate the cleavage products. (Left) Scheme summarizing the results of the experiment. The large arrowheads show positions where GreB cleaves the RNA in the active and arrested complexes. The numbers indicate the size of corresponding segments of the transcripts derived from GreB-induced cleavage or from treatment with RNase T1. For other symbols, see Fig. 3.

