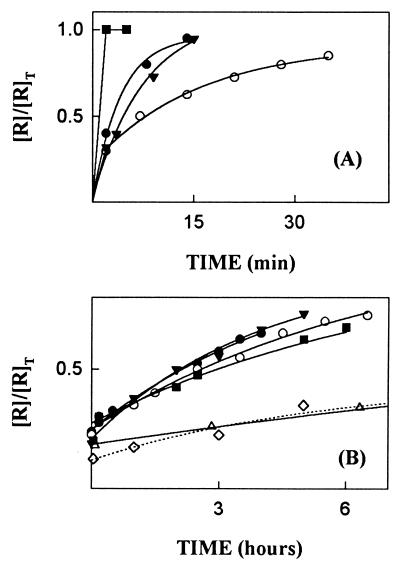
Figure 2.
Dissociation of the complexes of RNase A with RI mutants. [R]T and []R] are the total and free concentrations of RNase, respectively, at the times indicated. (A) Y434A (▪), D435A (•), Y437A (○), and des(460) (▾). (B) E287A (•), K320A (▾), E401A (○); C408A (▵); R457A (▪); wtRI (⋄). Additional data points were obtained for C408A and wtRI at times beyond those shown.

