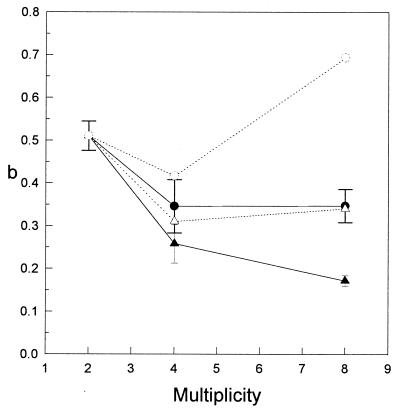
Figure 4.
The mean value of b, the probability of inactivation via an adjacent cell, for all experiments as a function of multiplicity. •, Mean value of b as given by model H1; ○, value of b(H1) adjusted for the size of the colony; ▴, mean value of b as given by model H2; ▵, adjusted value of b(H2). (Error bars = standard error.)

