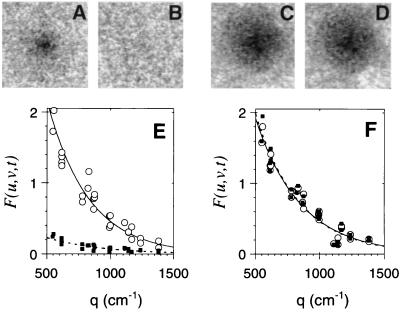
Figure 2.
Quantification of photobleached patterns in tumor tissue. Photobleached patterns are shown for xenograft tissue containing control S1 mAb (A and B) and CEA-specific ZCE025 (C and D) at times of 1 s (A and C) and 100 s (B and D) after laser exposure. Spatial detail of the pattern is quantified by two-dimensional Fourier transform of the images (E and F). An image is converted into a two-dimensional array of Fourier coefficients, each element with its own spatial frequency vector (u,v). The pattern is characterized by the plot of Fourier coefficient amplitude versus the spatial frequency magnitude q, where q2 = 4π2(u2 + v2), at t = 1 s (○) and 100 s (▪). Specific mAb (F) shows a greater persistence compared with the equivalent nonspecific molecule (E).

