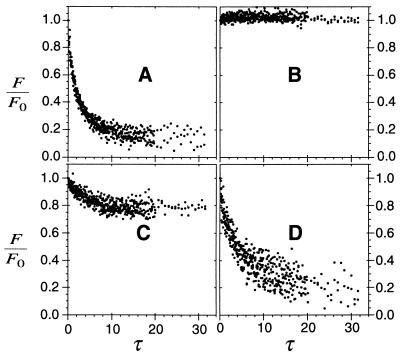
Figure 3.
Quantification of photobleaching recovery rate in tumor tissue. The decay of Fourier components (with spatial frequencies, q, from 500 to 900 cm−1) is shown for nonspecific S1 mAb, 6 nmol total injected dose (A); specific ZCE025 mAb, 0.3 nmol (B); ZCE025, 5 nmol (C); and ZCE025, 70 nmol (D). The dimensionless time parameter τ is scaled by the diffusion rate in free solution. Measurements were performed 24 h after i.v. injection of the specified dose. Notably biphasic decays that suggested discrete bound and unbound components (A, C, and D) were fit to Eq. 5, whereas slow, incomplete recoveries were fit with Eq. 7.

