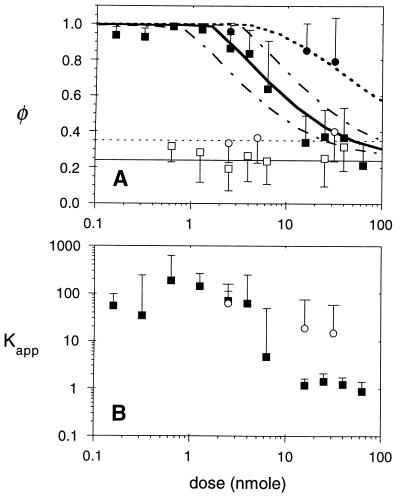
Figure 4.
In vivo binding isotherms. (A) Bound fractions of nonspecific S1 IgG (□) and S1 Fab′ (○) were independent of the total injected dose (mean values indicated by thin solid and dotted lines, respectively). Intact ZCE025 mAb (▪) exhibited near complete immobilization at low doses and binding site saturation above 2.5 nmol. ZCE025 Fab′ (•) exhibited a large bound fraction at all doses. Each data point represents the mean and standard deviation of at least 18 FRAP measurements in three xenografts. Theoretical binding curves are shown (thick solid line, intact IgG; dotted line, Fab′) for an in vivo CEA content of 0.56 nmol/g, calculated as described in the text. To show the sensitivity to the model parameters, IgG binding curves are also shown for 2-fold reduction (lower dashed line) and enhancement (upper dashed line) of binding site density (0.25 and 1.0 nmol/g). (B) The apparent binding affinity of anti-CEA molecules is calculated using Eq. 7, based on the observed initial rate of fluorescence recovery kobs and the diffusion coefficient of the nonspecific control molecule, Deff, taken from Table 1. The Kapp value is the factor by which specific binding slows the photobleaching recovery; values around 1 imply negligible specific binding. Median values for intact IgG (▪) and fragment (○) are plotted with error bars showing the 90th percentile values for Kapp. At low doses, Kapp should approach the product of the intrinsic association constant Ka and the binding site concentration Bmax.

