Fig. 2.
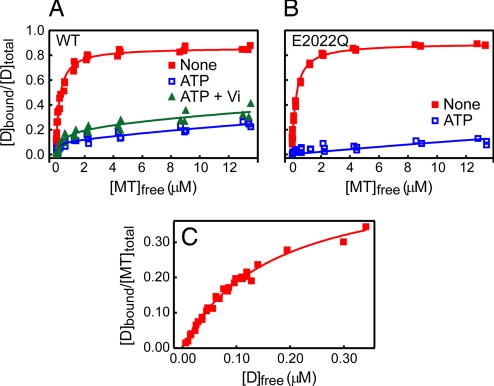
Steady-state MT binding of the dynein motor domain. (A) Cosedimentation assays were performed with a constant concentration (0.05 μM) of HFG380B2 and various concentrations (up to ≈14 μM) of MT in the absence of added adenine nucleotides (filled red squares) or in the presence of 3.3 mM ATP (open blue squares) or 1 mM ATP plus Vi (filled green triangles). The smooth curves are the best fits of the data to hyperbolas with the dissociation constants (Kd) and maximum bindings (Bmax) given in Table 1. (B) The same assay as described in A also was performed with HFG380B2/E2022Q in the absence of added adenine nucleotides (filled red squares) or in the presence of 3.3 mM ATP (open blue squares). The smooth curves are the best fits of the data to hyperbolas with the Kd and Bmax given in Table 1. (C) To determine the binding stoichiometry of dynein to MTs (tubulin dimer), a cosedimentation assay was performed with various concentrations (up to ≈0.7 μM) of HFG380B2 and a constant concentration (1 μM) of MT in the absence of added adenine nucleotides. The smooth curve is the best fit of the data to a hyperbola with a Kd of 0.17 ± 0.01 μM and a stoichiometry of 0.50 ± 0.02.

