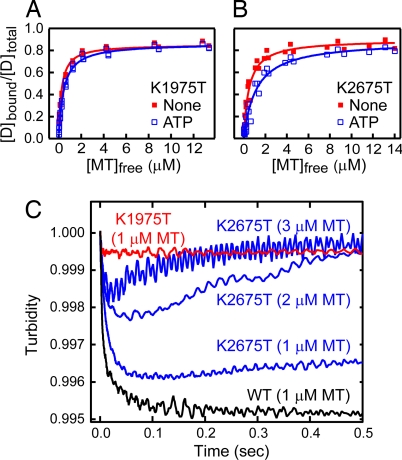
Fig. 5.
Effect of Walker A mutations on the ATP-induced dissociation. (A and B) Cosedimentation assays of HFG380B2/1975T (A) and HFG380B2/K2675T (B) with MT in the absence of added adenine nucleotide (filled red squares) or in the presence of 3.3 mM ATP (open blue squares). The smooth curves are the best fits of the data to hyperbolas with the dissociation constants (Kd) and maximum bindings (Bmax) given in Table 1. (C) Representative time courses of the ATP-induced dissociation of the complex of MT and HFG380B2, HFG380B2/K1975T, or HFG380B2/K2675T after mixing with 1 mM ATP. For the K2675T mutant, the experiments also were performed with higher concentrations of MT (2 and 3 μM) in addition to 1 μM to make the reassociation process clearly observable.

