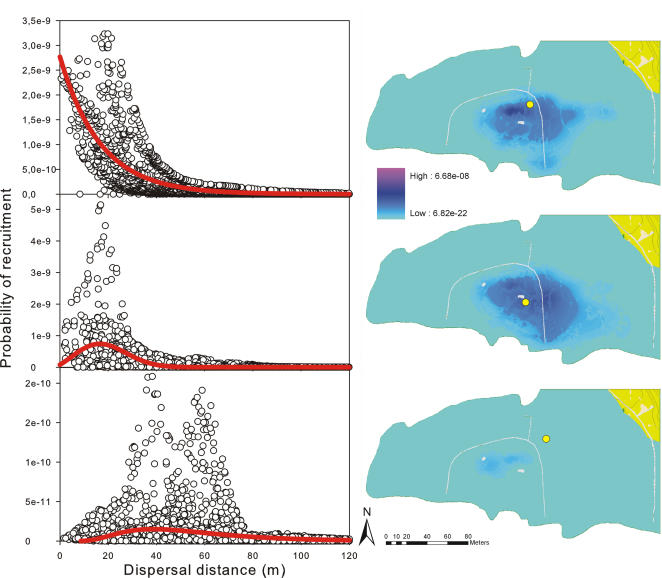
Figure 3. Three types of relationship between dispersal curves and plant recruitment kernels found for the lizard-shrub study system.
The three 1D curves and recruitment kernels are selected among those modelled for the 38 plants present in the study area. For each plant, we calculated the combined recruitment kernel provided by the 10 studied lizards (see Figure 2) and subsequently fitted a one-dimensional curve to a sample of 5000 points randomly selected from the modelled recruitment kernel. For a complete list of regression results of 1D fits for the 38 study plants (including individuals 9, 13 and 2, shown here), see Table S11.

