
Fig. 2.
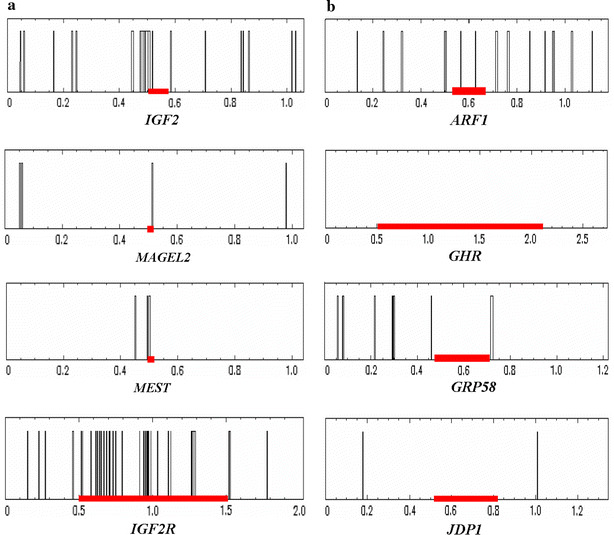
Distribution of CpG islands in a subset of (a) imprinted and(b) biallelically expressed genes with 50-kb upstream and downstream flanking sequences. Vertical bars indicate position of each CpG island and the thick line on the x axis corresponds to the coding region of the gene. The position of each genomic region counts from the upstream flanking region of each gene (×105 bp). The distribution of CpG islands in other genes examined is presented in Supplementary Fig. 1