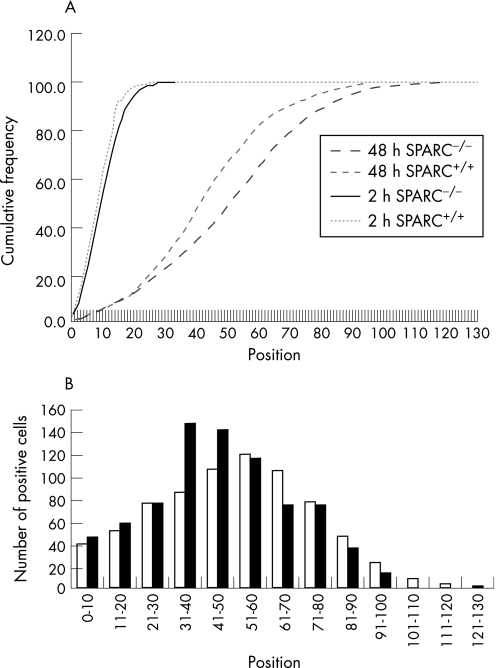
Figure 3 Sparc deficiency accelerates enterocyte movement along the crypt villus axis. (A) Cumulative frequency plot showing the distribution of bromodeoxyuridine (BrdU)‐labelled cells along the length of the crypt–villus axis 2 and 48 hours after exposure to BrdU. At 2 hours there is no difference in distribution between Sparc−/−ApcMin/+ and Sparc+/+ApcMin/+ mice (Kolmogorov–Smirnov, p = 0.3). At 48 hours, enterocytes in the Sparc−/−ApcMin/+ mice have moved significantly further along the axis, indicated by a shift in the graph to the right (Kolmogorov–Smirnov, p = 0.01). (B) The distribution at 48 hours; open bars, Sparc−/−ApcMin/+, closed bars, Sparc+/+ApcMin/+. For all data, a minimum of three mice were used of each genotype.

An official website of the United States government
Here's how you know
Official websites use .gov
A
.gov website belongs to an official
government organization in the United States.
Secure .gov websites use HTTPS
A lock (
) or https:// means you've safely
connected to the .gov website. Share sensitive
information only on official, secure websites.
