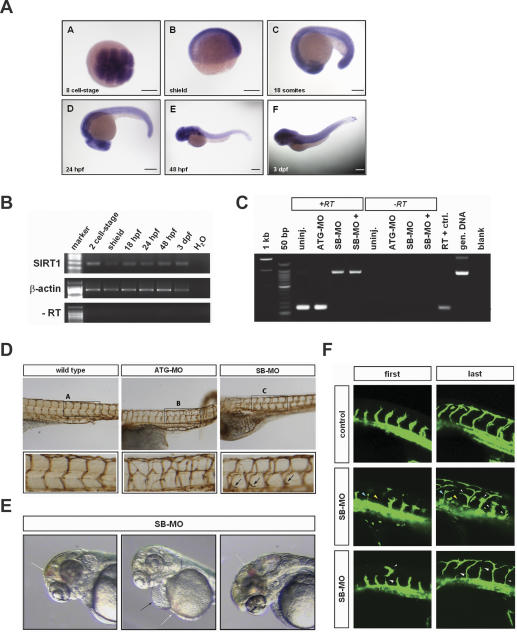
Figure 4.
Cardiovascular defects in SIRT1-deficient zebrafish embryos. (A) SIRT1 expression at different stages of zebrafish development. (Panels A–F) SIRT1 antisense probe. (Panel A) Dorsal view. (Panels B–F) Lateral views. The embryonic stage is indicated at the bottom left corner. (8-cell stage) maternal expression; (shield) zygotic expression. Bars, 200 μm. (B) RT–PCR analysis performed on total RNA extracted from embryos at the indicated stages using primers specific for SIRT1. β-actin serves as loading control. (C) RT–PCR analysis of SIRT1 mRNA transcripts in control, ATG-MO-injected, and SB-MO-injected embryos. Specific and effective splice-blocking of the SIRT1 transcript in the SB-MO-injected embryos. SB-morpholinos were injected at two different concentrations (SB-MO+ indicates twice the amount of the morpholino as compared with SB-MO). The exon 2–exon 3 spliced form is 249 bp, and 701 bp is the fragment including the intron 2 sequence. (D) Lateral views of the vasculature from either control or SIRT1 knockdown (ATG-MO and SB-MO) zebrafish embryos. Pictures were taken from fixed embryos after immunohistochemistry with an anti-GFP antiserum using a stereomicroscope. (E) Hemorrhages (white arrows) and pericardial swelling (black arrow) in SIRT1 knockdown zebrafish (SB-MO). (F) First and last frame (GFP fluorescence) of time-lapse movies captured from control embryos (24 hpf) and embryos injected at one- to two-cell stage with a SIRT1 splice-blocking morpholino. The embryo’s head is to the left, dorsal is to the top. Arrowheads point to vessels defects.

