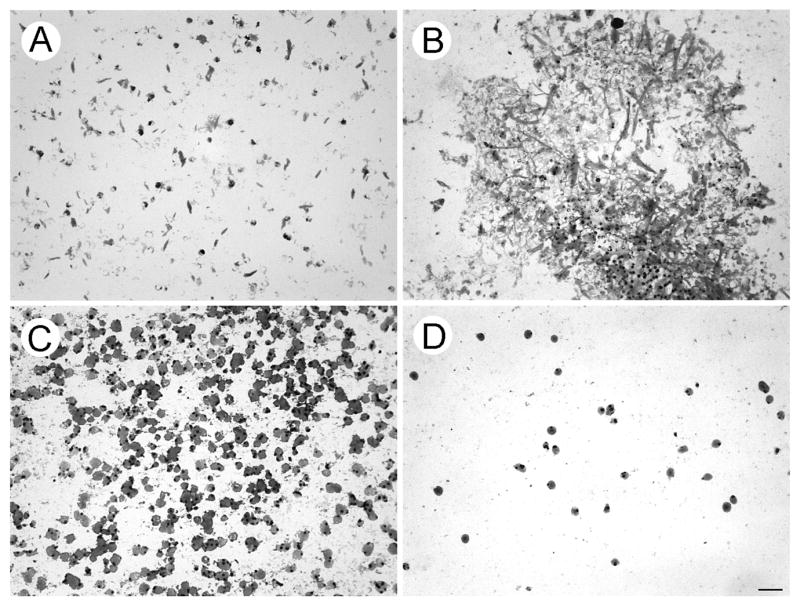
Figure 3.

Pseudopodia of tumor cells responding to HGF and serum. Cytoplasmic projections extruded through 3 μm pores were fixed and attached to glass slides prior to filter removal and staining. A. & B. demonstrate elongated pseudopodial profiles formed by cells from ultrasonic aspirations and minced tumor, respectively. C. & D. demonstrate rounded pseudopodial profiles formed by cells from ultrasonic aspirations and minced tumor, respectively. The pseudopodia stained homogeneously with Diff Quik except for condensations consistent with locations of pores prior to removal of filters. The assay in Fig. 2 demonstrated that the leading edge of a migrating cell population was included in the pseudopodia shown. Since the pore density of the filters varied according to pore size (to maintain consistent tensile strength), 20-fold greater numbers of pores were present in filters used for formation of pseudopodia compared to the filter used for cell migration. Only a few nuclei migrated through the 3 μm pores and a darkly stained, migrated nucleus is located in the mid region and near the top of panel B. Diff Quik stain. The magnification bar represents 25 μm.
