
Figure 2.
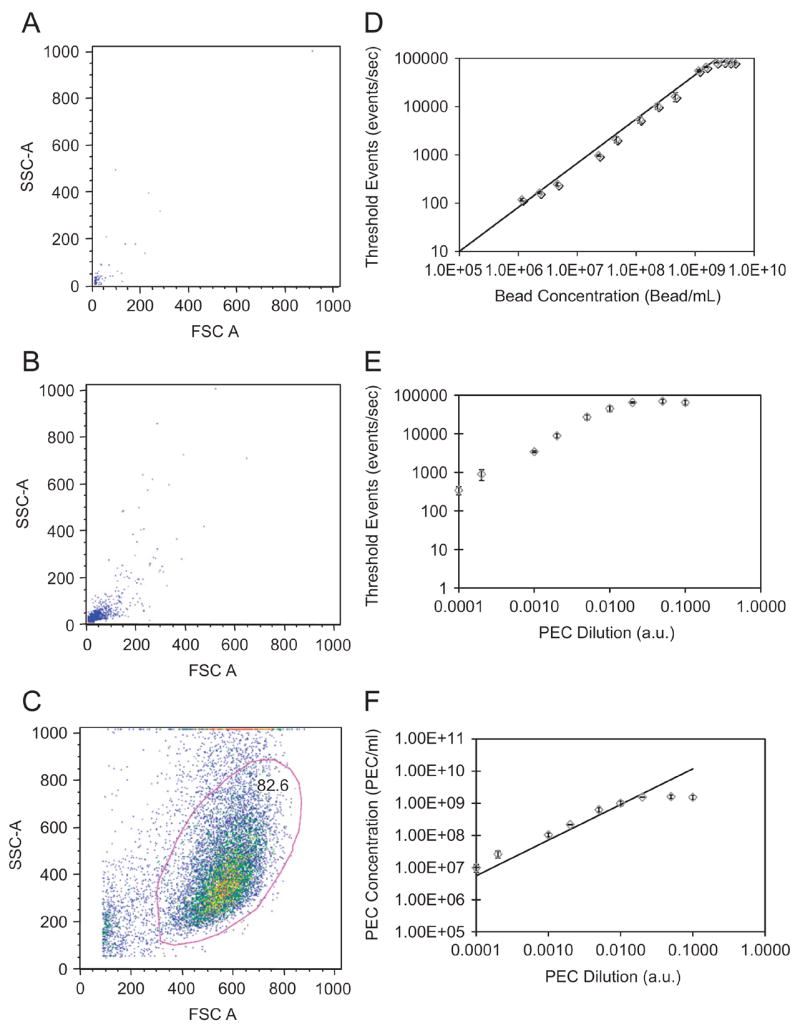
Evaluation of PEC concentrations by flow cytometry. FACS analyses of (A) NIST traceable fluorescent green beads and (B) multi-component PEC suspended in HMVEC growth media; (C) gating of HMVECs showed little or no overlap between cellular and PEC gates, while PEC and 200 nm bead share similar forward (FSC) and side (SSC) scattering. (D) calibration plot (detected events v. bead concentration) generated for various dilutions of NIST beads. (E) measured detected events versus arbitrary PEC dilutions per batch; (F) the calculated concentration of PEC based on the bead standardization. Error bars are the standard error for n=3.