
Figure 3.
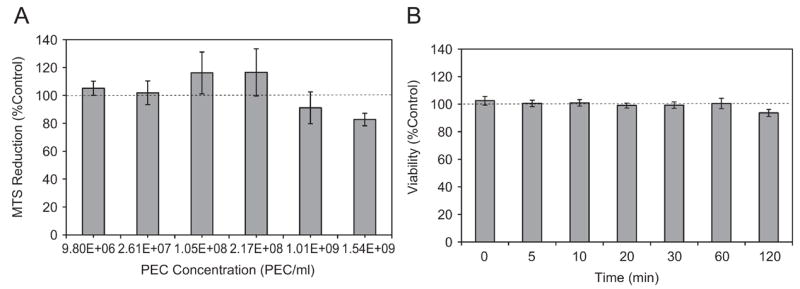
PEC cytotoxicity profiles for multi-component PEC. (A) MTS reduction after 72 h incubation over various serial dilutions; (B) propidium iodide staining at a fixed concentration of 1.54×10⁹ PEC/ml. One-way ANOVA showed no significant difference as a function of dose or time, while Dunnet’s test showed that each mean was statistically the same as the control (no PEC), p <0.05. Data are means of at least 3 experiments (mean ± s.e.).