
Figure 7.
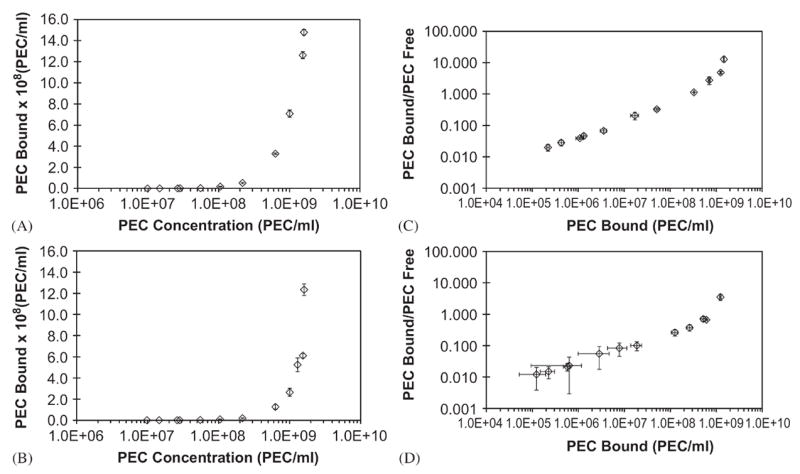
Binding isotherms for PEC on HMVEC at 37°C and 4°C. 3h incubations were performed at 37°C, (A) and (C), or at 4°C, (B) and (D). Binding was estimated by FACS (n=3). (A) and (B) show dose-dependent binding curves; (C) and (D) represented Scatchard plot analysis. The ratios of bound and free PEC for each concentration were determined based on the median fluorescence index of each dose in the absence of cells, follwed by correlation to calibration curves.