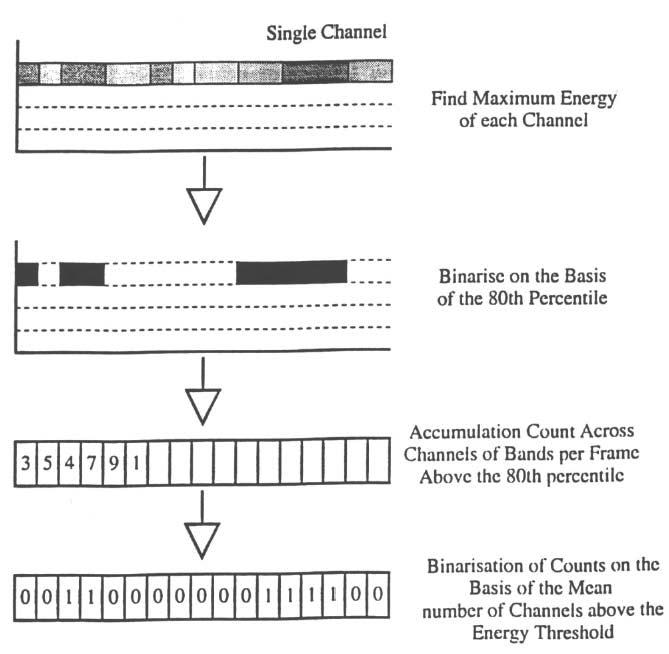
Figure 3.

Schematic summary of the steps involved in fragmenting the speech into energy and silence. The depiction in the top section is in conventional spectrogram format: Time is plotted along the abscissa, frequency along the ordinate, and energy is represented on a grey scale. The steps in computation in the top two sections are shown for a single frequency band of the vocoder outputs.
