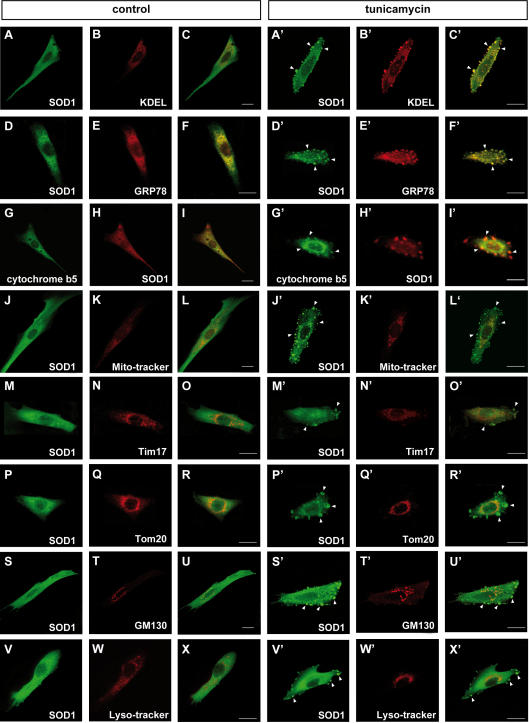
Figure 3. Positive translocation of SOD1 aggregates to ER, but not to the mitochondria, Golgi apparatus, or lysosomes.
(A–I, A′–I′) Stress-dependent localization of SOD1 to the ER. L84V SOD1-expressing SK-N-SH cells were incubated for 24 h without (A–I) or with 1 µg/ml of tunicamycin (A′–I′). Then the cells were fixed and stained using an anti-SOD1 antibody (green; A, D, A′, D′) and an anti-KDEL antibody (red; B, B′) or an anti-GRP78/BiP antibody (red; E, E′). GFP-cytochrome b5 were transfected to the cells and stained with anti-GFP (green; G, G′) and anti-SOD1 (red; H, H′) antibodies. Merged images (C, F, I, C′ F′, I′). The aggregates of SOD1 (arrowheads) are positive for KDEL, GRP78/BiP and cytochrome b5. (J–R, J′–R′) Analysis of SOD1 localization to the mitochondria. L84V SOD1-expressing SK-N-SH cells were treated as described in above. The locations of the mitochondria and SOD1 were visualized in L84V SOD1-expressing SK-N-SH cells using 100 nM Mito-tracker (red; K, K′), an anti-Tim17 antibody (red; N, N′) or an anti-Tom20 antibody (red; Q, Q′) and an anti-SOD1 antibody (green; J, M, P, J′, M′, P′). Merged images (L, O, R, L′, O′, R′). (S–U, S′–U′) Investigation of SOD1 localization to the Golgi apparatus. L84V SOD1-expressing SK-N-SH cells were treated as described in above. Then the cells were stained with anti-SOD1 antibody (green; S, S′) and anti-GM130 antibody (red; T, T′). Merged images (U, U′). (V-X, V′-X′) Analysis of the localization of SOD1 to the lysosomes. A GFP-tagged L84V SOD1 vector was transfected into L84V SOD1-expressing SK-N-SH cells. After 24 h of incubation with 1 µg/ml of tunicamycin, the cells were incubated for a further 30 min with 100 nM Lyso-tracker (red; W, W′) to visualize the lysosomes. GFP channel (V, V′) Merged images (X, X′). Scale bars = 20 µm. Arrowheads indicate aggregated SOD1.

