Fig. 5.
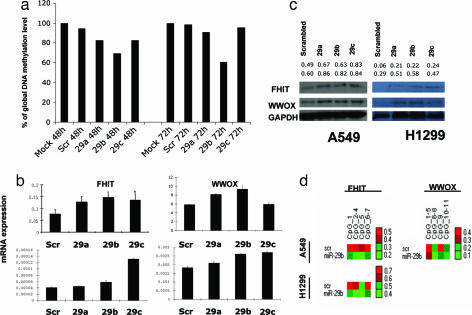
Effect of restoration of miR-29s on the cancer cell epigenome. (a) Global DNA methylation changes induced by miR-29s on A549 cells harvested 48 and 72 h after transfection. The results are compared with nontransfected (mock) cells and cells transfected with a scrambled oligonucleotide. (b) Determination of FHIT and WWOX mRNA levels in A549 and H1299 cells 48 h after transfection with miR-29s or a negative control by qRT PCR; miR-29s induced reexpression of FHIT and WWOX mRNAs. (c) Immunoblot of Fhit and Wwox proteins in A549 and H1299 cells 72 h after transfection with miR-29s or negative control; by 72 h, miR-29s induce increased expression of Fhit and Wwox proteins. The numbers above the immunoblot images represent the intensity of the bands relative to the GAPDH gene (upper row, Fhit; lower row, Wwox). (d) Graphical representation of the quantitative DNA methylation data for FHIT and WWOX promoter region by using the MassARRAY system. Each square represents a single CpG or a group of CpGs analyzed, and each arrow represents a sample. Methylation frequencies are displayed for each experiment in a color code that extends from light green (lower methylation frequencies) to bright red (higher methylation frequencies).

