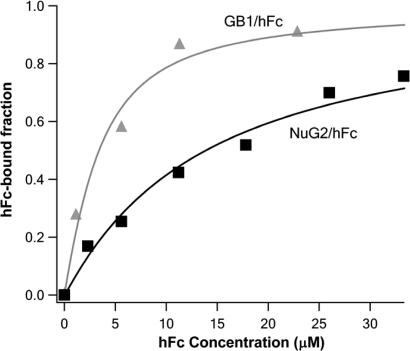
Fig. 3.
Accurate determination of dissociation constant Kd using force-spectroscopy-based single-molecule binding assay. The fractions of hFc-bound NuG2 and wt-GB1 are plotted against the initial concentration of ligand hFc in the binding isotherm (squares, NuG2/hFc; triangles, wt-GB1/hFc). Solid lines are fits to the binding isotherms using a single binding site model that takes into account all of the species present in solution (black line, NuG2/hFc; gray line, wt-GB1/hFc). The measured Kd is 12.6 ± 0.9 μM for the binding of hFc to NuG2 and 2.2 ± 0.4 μM for the binding of hFc to wt-GB1.

