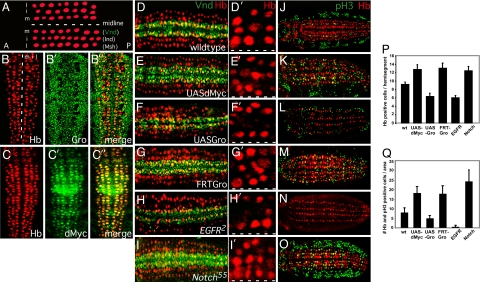
Fig. 2.
Regulation of cell fate and mitosis in the developing Drosophila neuroectoderm (CNS). (A) Diagram depicting the three rows of neuroblasts (red) that are observed on each side of the midline (white dashed line) of a stage 9 embryo and the homeobox transcription factors (Vnd, Ind, and Msh) that specify them: m, middle (ventral); i, intermediate; l, lateral. Anterior (A) is to the left. (B–C′′) Gro and dMyc are expressed during Drosophila neurogenesis. (B) Stage 9 embryos were immunostained with Gro (B′ and B′′) or dMyc (C′ and C′′). Neuroblasts are identified by Hunchback (Hb) staining (red; B and C). Anterior is up. (D–O) Opposing regulation by dMyc/EGF and Gro/Notch of neuroectoderm cell fate, neuroblast number, and mitosis in the developing Drosophila CNS/neuroectoderm. Stage 9 embryos were immunostained with Hb (red) to identify neurons (D–O) and either Vnd (green), a dMyc-Gro direct target whose expression overlaps with and is required for S1 neuroblasts (D–I′), or the mitosis marker phosphohistone3 (pH3; green) (J–O). Anterior is to the left. Wild-type embryos are depicted in D and J. Rho-Gal4 was used to drive the expression of dMyc (two copies; UAS-dMyc) (E and K) or Gro (one copy; UAS-Gro) (F and L) in the neuroectoderm. Embryos lacking Gro function (FRT-Gro) were generated via germ-line clones (G and M). Egfr2 (H and N) and N55e11 (I and O) are LOF alleles for EGF receptor and Notch, respectively. (D′–I′) Higher magnification of one hemisegment from the embryos in D–I, respectively, depicting neuroblasts (red). The dashed white line indicates the position of the midline. (P) Quantification of the number of neuroblasts as identified by Hb-positive staining per hemisegment (n = 40 hemisegments). (Q) Quantification of the number of neuroblast mitoses as identified by cells dually positive (yellow) for Hb (red) and phospho-H3 (green) staining per 10 hemisegment area (n = 10 embryos).

