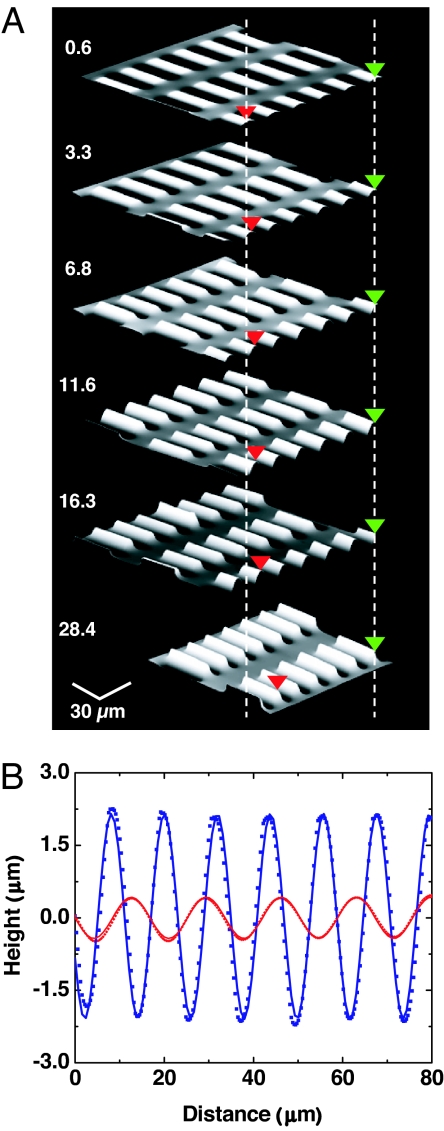
Fig. 3.
The wavelength decreases as the prestrain increases, and the behavior of the buckled thin film is highly sinusoidal. (A) Atomic force micrographs of buckled Si ribbons (100 nm thickness) on PDMS, formed with various prestrains (indicated on the left in percent). The red and green triangles and the vertical dashed lines define particular relative locations on the samples, to illustrate more clearly the changes. The wavelength systematically decreases as the prestrain εpre increases. (B) Line cut profiles of a representative ribbon for the cases of εpre = 28.4% (blue) and εpre = 0.6% (red). The symbols are measured data; the lines are sinusoidal fits.

