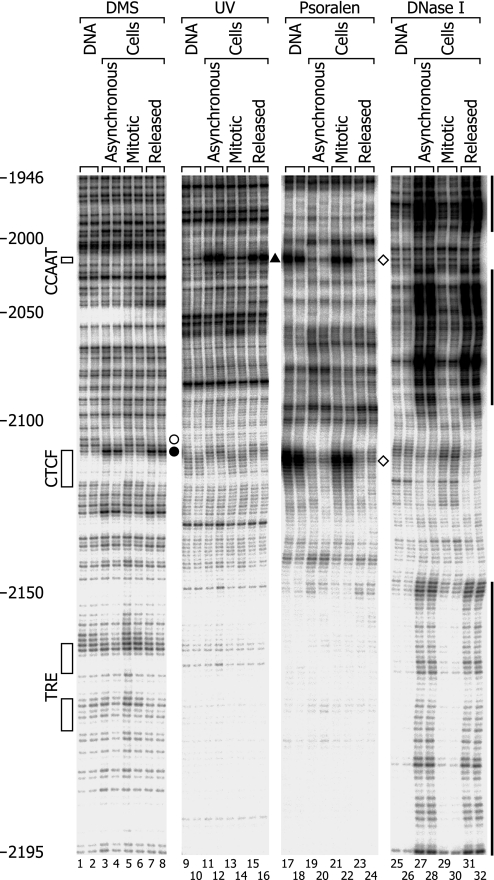
Fig. 3.
In vivo footprinting analysis of the lower strand of the region of the c-MYC insulator element. Primers MYCL1 and MYCL2 were used. The four blots are from two gels and are aligned. The solid circle between lanes 8 and 9 indicates the site of increased formation of methylguanines in vivo. Other notations are similar to those in Fig. 2.

