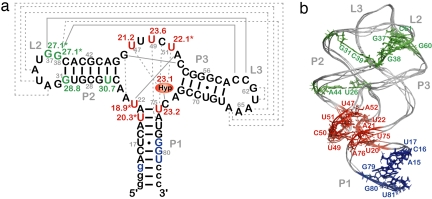
Fig. 2.
Secondary (a) and tertiary (b) structure of GSRapt with kinetic results. Red, half-life values [t1/2 (s)] in the time range 18.9–23.6 s; green, half-life values in the time range 27.1–30.7 s; blue, signals that remain unaffected during the structural transition; asterisk, overlaid signal (for further information, see text); Hyp, hypoxanthine; labeling of helices P1, P2, and P3 and loop regions L2 and L3, according to Breaker et al. (18); gray solid lines, Watson–Crick base-pairing interactions; gray dashed lines, noncanonical base-pairing interactions [for construct details, see supporting information (SI) Fig. 5].

