Fig. 4.
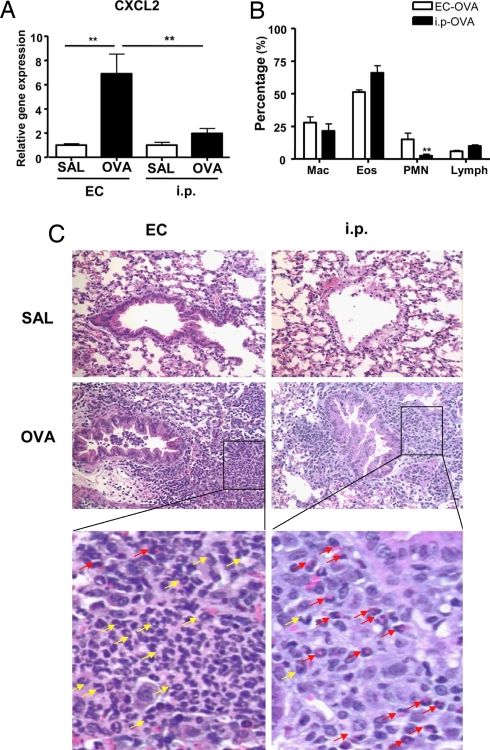
Neutrophil influx in allergen-challenged lungs of EC-sensitized and i.p.-immunized mice. (A) CXCL2 mRNA expression in lung tissues. Values for lungs of saline-sensitized mice have been set to 1. (B) Percentage distribution of cell types in BALF. (C) H&E staining of lung sections from mice EC- and i.p.-sensitized with saline or OVA after OVA-inhalation challenge. Magnification ×200. Further magnification of the black-bordered box shows the predominance of neutrophils (yellow arrows) in lungs from OVA EC-sensitized mice and of eosinophils (red arrows) in lungs from OVA i.p.-sensitized mice. Columns and error bars represent means ± SEM (n = 5–6 per group). *, P < 0.05; **, P < 0.01. SAL, saline.

