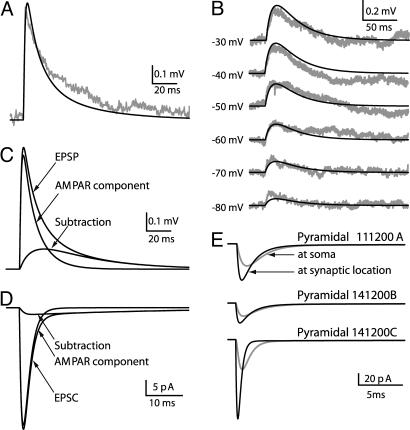
Fig. 2.
Extracting synaptic parameters through fitting model to experiments. (A) An experimental average EPSP (n = 39) measured from the postsynaptic L2/3 neuron belonging to pair 111200A (gray line). The dark line is the model fit. (B) Isolated NMDAR-mediated voltage responses at different holding potentials (marked at left) recorded from another L2/3 pyramidal cell (gray lines). The model fits, which were based on morphology and locations of synaptic contacts for 111200A pair, are depicted by dark lines. (C) AMPAR and NMDAR components of the modeled EPSP in A. (D) AMPA- and NMDA-mediated currents under voltage–clamp (at −75 mV) in soma of modeled cell. (E) Space–clamp error in estimating synaptic current. Synaptic contacts were activated at their dendritic sites (blue points in Fig. 1), and voltage–clamp was applied at the soma (−75 mV). The measured synaptic current at the soma for the three cells modeled is shown in gray, and the case without space-clamp error is depicted by the corresponding black lines.

