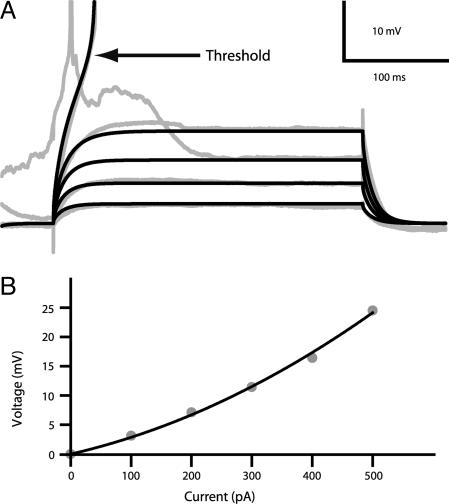
Fig. 4.
Sub- and suprathreshold behavior for model compared with experiments. (A) Voltage recording from a L2/3 pyramidal cell recorded in vivo during 300-ms current steps, 100–500 pA (5) in gray compared with model response to the corresponding current step in black. (B) Steady-state V–I relationship shows anomalous rectification. Only Down state periods were analyzed (5) (gray dots). The black line is the second-order polynomial fit to the model I–V curve.

