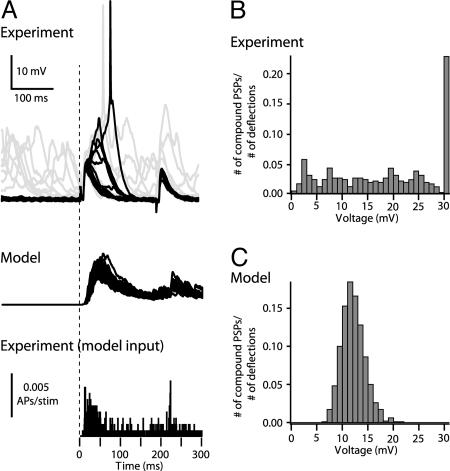
Fig. 5.
Distribution of compound PSP amplitudes after whisker deflection, experiments vs. model. (A) Top trace. Records of 20 responses of a barrel-related L2/3 pyramidal cell to principal whisker deflection (courtesy of M. Brecht). Responses from the Down state are black (middle trace): 20 responses of the model-to-whisker deflection (lower trace). In vivo PSTH of L4 neuron after whisker deflection (n = 25) was used as an input for model (see Materials and Methods). The vertical dashed line denotes time of whisker deflection. (B) Experiments. (C) Model distribution of PSP amplitude from the Down state after whisker deflection.

