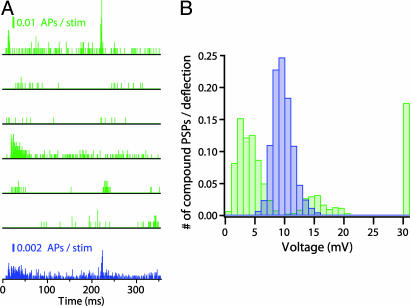
Fig. 6.
Predicted distribution of the L2/3 compound PSPs when using either the average PSTH or that of individual L4 cells. (A) In vivo PSTH of six L4 neurons after whisker deflection (green) and the average PSTH (blue) (see Materials and Methods). (B) Composite PSP amplitude distribution after whisker deflection predicted by the model based on either individual PSTH shown in A (green histogram, n = 1,000) or the average PSTH (corresponding blue histogram, n = 1,000). Spiking is evoked for PSPs larger than 30 mV (rightmost bar).

