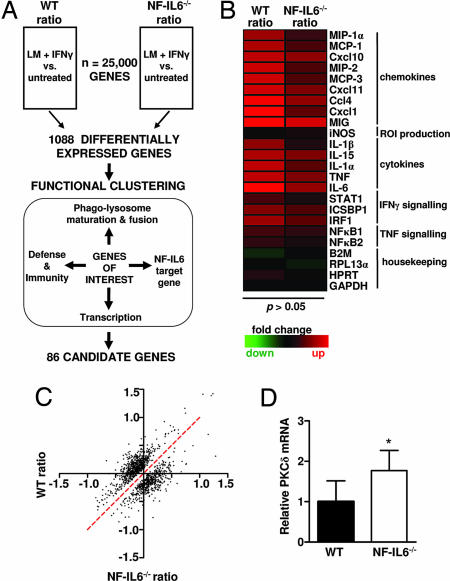
Fig. 1.
Identification of PKCδ by microarray. (A) Differential microarray and functional clustering to identify candidate genes. BMDMs from WT and NF-IL6−/− mice were untreated or were simultaneously activated with IFN-γ and infected with LM (LM + IFN-γ). RNA was isolated from untreated and infected samples at 4 h p.i. and used to generate labeled cDNA probes, which were hybridized to the microarray. DE genes were identified by comparing the log2-transformed ratio (LM + IFN-γ vs. untreated) for each gene between all four WT and NF-IL6−/− microarrays. DE genes were functionally clustered, and genes belonging to multiple functional categories were selected for further study. (B) Heat map showing up-regulation of proinflammatory mediators in both WT and NF-IL6−/−-infected BMDMs. Rows represent individual genes, and columns show the log2 transformed gene expression ratio. Up- or down-regulated genes in the LM plus IFN-γ sample, as compared with the untreated, are shaded red or green, respectively. (C) Scatter plot of the DE genes. Plotted on the x and y axes are the gene expression ratios for WT and NF-IL6−/− mice. The red dotted line represents non-DE ratios. (D) Quantitative RT-PCR confirming higher PKCδ mRNA levels in infected NF-IL6−/− BMDMs as compared with WT. Data shown are means ± SEM (*, P < 0.05).

