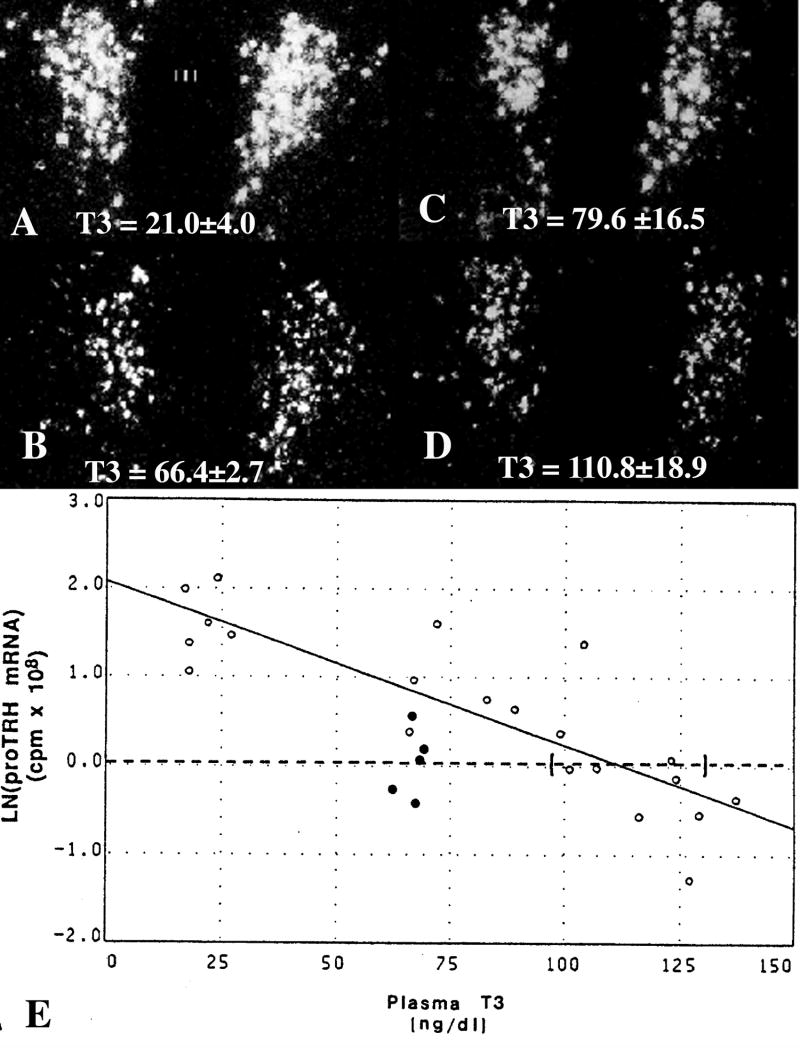
Figure 10.
In situ hybridization autoradiographs of proTRH mRNA in the paraventricular nucleus (PVN) in (A) hypothyroid, (B) euthyroid and (C) hypothyroid animals receiving a constant infusion of (C) 0.5 μg or (D) 0.75 μg of T3/100 gm/bw/d. Mean plasma triiodothyronine (T3) levels (±SEM) are shown for each group at the bottom of the photomicrographs. Note that only the higher dose of T3 that raised plasma T3 levels into the supranormal range was capable of suppressing TRH mRNA to euthyroid levels. (E) Regression analysis of above experiment. Interrupted line represents the mean ln(TRH mRNA) for euthyroid animals and its intercept with the regression line estimates the plasma T3 concentration required to suppress proTRH mRNA to euthyroid levels. Ninety-five percent confidence intervals for each intercept are bracketed. Open dots denote values for hypothyroid animals and hypothyroid animals infused with graded doses of T3. Closed dots denote values for euthyroid controls. (Modified from Kakucska et al [109], copyright 1992, with permission from The Endocrine Society.)

