
Figure 11.
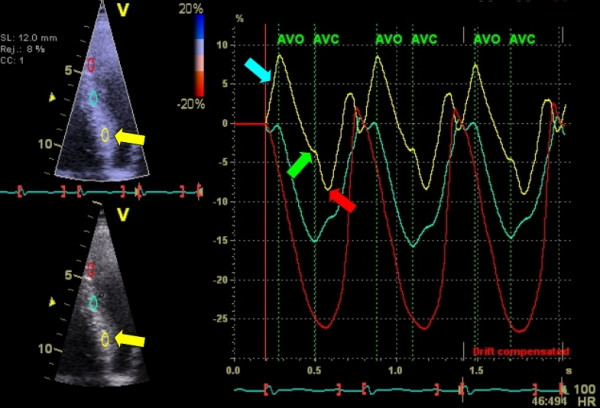
Tissue Doppler derived strain curve of three cardiac cycles of a patient suspected for HCM. Yellow-curve/arrow = basal segment, cyan = mid, red = apex. Note the abnormal deformation pattern in the yellow curve. There is prestrech (blue arrow), a reduced peak systolic value (green arrow) and post-systolic shortening (red arrow).