
Figure 16.
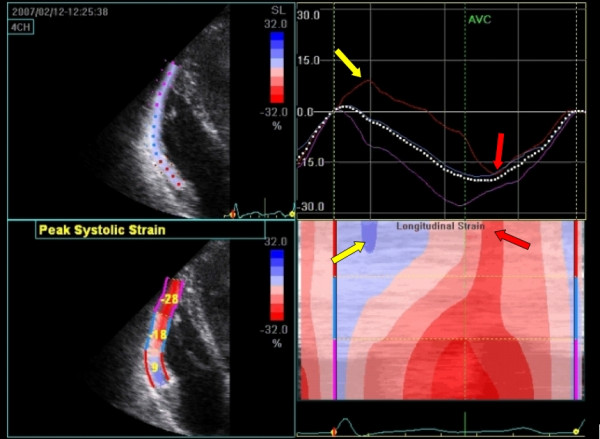
Deformation imaging of the right ventricle in a patient suspected for ARVD. 2DSE trace of the right ventricle during one cardiac cycle (top-left). Note the low peak systolic strain (bottom-left) in the basal segment. When visualized graphically (top-right) or with color-map M-mode (bottom-right) the abnormal deformation pattern becomes evident, there is prestretch (blue area on M-mode and positive deflection in graph, yellow arrow) and post-systolic shortening (negative deflection after pulmonic valve closure (AVC) in the graph and late-red area on the color-coded M-mode, red arrow). 2DSE deformation imaging can be seen in the additional file (see Additional File 3).