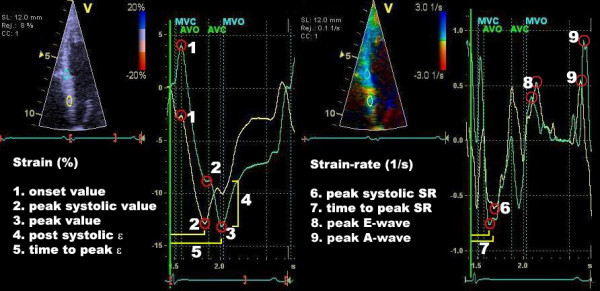
Figure 7.

Strain and strain-rate parameters. Left: s train (ε) and right: strain-rate (SR) measurements of the basal and mid segment of the interventricular septum. Note the prestretch and the post systolic shortening (4) in the cyan curve. Post systolic strain is defined as the amount of deformation after the AVC (value 3 minus value 2). In the yellow curve, the peak systolic value and the peak value are the same, while in the cyan curve these are two distinctive points (2 and 3). From this, the post-systolic index (PSI) can be calculated: (4)/(3) × 100 = PSI (%). The definition of the onset value (1) could also be defined at the onset of the QRS-complex for the yellow curve.
