
Figure 4.
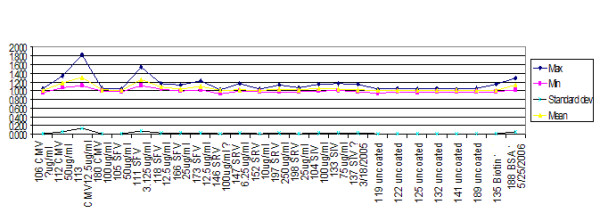
Ratio of trimmed mean/median. For this study, it was useful to use trimmed mean so that standard deviations would be available for each reading. This graph shows that the trimmed mean is close to the median which is commonly used for this instrument. This is also a strong indication of normal distribution. Y axis is mean fluorescent intensity (MFI).