
Figure 14.
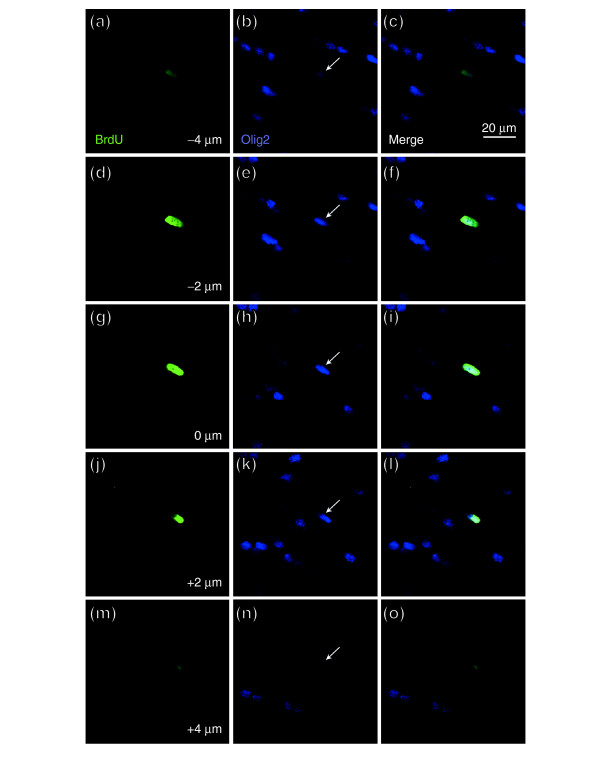
Representative z-stack of a BrdU+/Olig2+ cell. Photographs were taken as for Figure 13. Identical analyses were conducted for every cell that was scored as BrdU+ and expressing a cell-type specific antigen, as shown in Figure 4. As seen, the BrdU+ nucleus (green) was that of the Olig2+ cell (blue) indicated by a white arrow. Each row shows, from left to right, BrdU incorporation, staining for Oligo2, and the merged image. Images taken at (a-c) -4 μm; (d-f) -2 μm; (g-i) 0 μm; (j-l) 2 μm; (m-o) 4 μm.