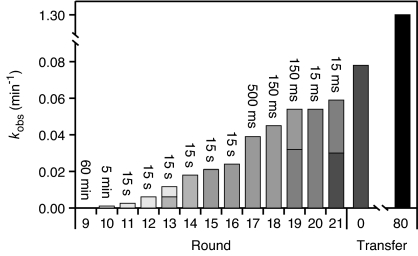
Fig. 3.
Increase in catalytic activity of the population over successive rounds of evolution. Reaction times for each round of stepwise evolution are given above each bar. The activity of the populations used to initiate continuous evolution (transfer 0) and obtained after transfer 80 are shown at the right. Reactions were carried out under continuous evolution conditions, but excluding the protein enzymes. Increasingly darker shading during the stepwise rounds indicates successive applications of mutagenic PCR, with split bars indicating the activity of both the mutagenized and nonmutagenized populations.

