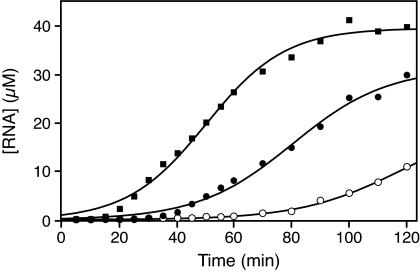
Fig. 5.
Amplification profiles of individual ribozymes in the continuous evolution mixture. Filled and open circles, T80-1 ligase using either the full-length or truncated substrate, respectively; filled square, T100-1 ligase using the truncated substrate. The concentration of RNA was determined at various times, and the data were fit to the logistic equation: [RNA] = a/(1 + be−ct), where a is the maximum extent of amplification and c is the exponential growth rate. Curvilinear regression coefficients were in the range of 0.996–0.999.

