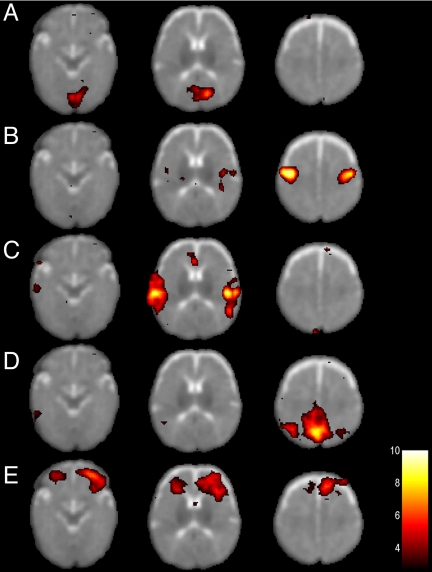
Fig. 1.
Resting-state networks in a single infant. Five resting-state networks are shown that were consistently observed in all infants. Each row represents one resting-state network shown at three representative axial sections. Statistical maps are thresholded at P > 0.5 (alternative hypothesis threshold for activation vs. null) and shown superimposed on the T2-weighted infant image template. The left side of the image corresponds to the left side of the brain.

